Where Is The Capital in Crypto? A Look at App Capital, a Durable Metric of Blockchain Adoption
Defining App Capital App Capital can be thought of as the economic mass of a blockchain’s application layer. It measures the sum of all circulating market capitalizations of tokens built on a chain, e
Defining App Capital
App Capital can be thought of as the economic mass of a blockchain’s application layer. It measures the sum of all circulating market capitalizations of tokens built on a chain, explicitly excluding the chain’s native token. This distinction is critical: by removing the reflexivity of native token valuations, App Capital provides a purer lens into how much real user capital is entrusted to applications on that chain.
Unlike conventional metrics such as total value locked (TVL), trading volumes, or fully-diluted valuations, App Capital is difficult to distort. Specifically, TVL can double or triple count underlying capital due to rehypothecation with integrations across protocols. Because App Capital is derived from circulating supply rather than arbitrary fully diluted valuation (FDV) calculations, chains cannot inflate their standing with low-float token launches, artificial incentives, or wash-traded volume. In this sense, App Capital represents one of the most durable, unambiguous, and operative measures of blockchain adoption.
App Capital Calculations
Ethereum’s Lead
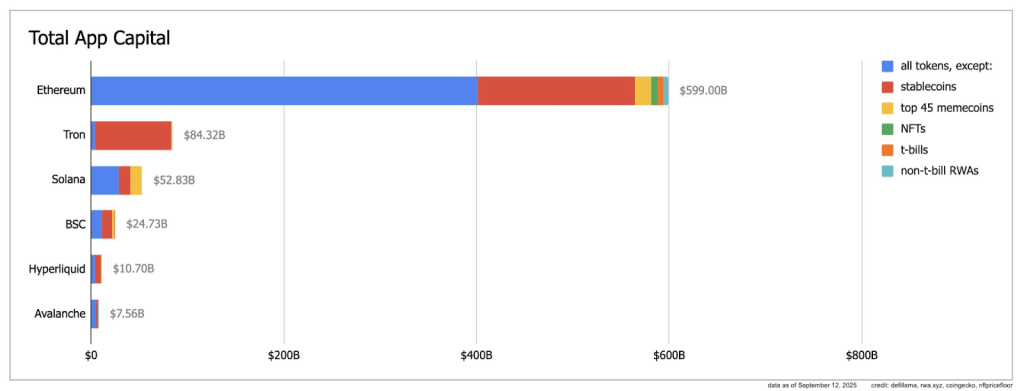
The chart makes Ethereum’s dominance clear: with $599B of App Capital, it accounts for roughly 77% of all capital across the leading L1s. Around 90% of this resides directly on Ethereum L1, with the other ~10% deployed across Ethereum L2s. Importantly, ~99% of L2 App Capital lives on rollups that purchase blobspace, underscoring the virtuous cycle of Ethereum’s rollup-centric roadmap.
This concentration reflects Ethereum’s ability to serve as a secure settlement layer for diverse forms of user capital: stablecoins, DeFi protocols, tokenized real-world assets (RWAs), NFTs, and more. Ethereum’s balance is also noteworthy—only ~3% of its App Capital is in memecoins, a relatively modest allocation compared with Solana (21%) and BSC (8%). This composition suggests Ethereum’s app layer skews toward more durable and productive capital bases.
Organic vs. Synthetic Growth
The growth of App Capital can occur along two trajectories. The organic path depends on user trust and the intrinsic quality of the chain’s governance, security, and developer ecosystem. Users willingly deposit capital because they believe the infrastructure is resilient, transparent, and aligned with their interests.
The synthetic path occurs when an L1 or its affiliates attempt to buy growth—through acquisitions, token incentives, or ecosystem funds. While not inherently bad, this strategy faces hard limits. Insiders cannot endlessly sell their native token to subsidize capital inflows. Such cycles may elevate an L1 to the $50B–$100B range, but they cannot sustain the momentum needed to reach trillions. In contrast, Ethereum’s App Capital trajectory reflects the slower, more credible path of compounding organic growth.
Structure of App Capital
The composition of App Capital reveals additional insights:
Stablecoins: The anchor of most ecosystems, stablecoins represent highly liquid and trusted user deposits. Ethereum leads here with a broad diversity of issuers and integrations, whereas Tron’s dominance ($84B App Capital) is almost entirely stablecoin-driven, reflecting a narrower use case.
Memecoins: While culturally powerful and often liquid in the short term, memecoins are volatile stores of user capital. Ethereum’s restrained share (~3%) looks healthier compared with Solana’s high exposure (~21%).
RWAs and T-Bills: Ethereum is the clear leader in tokenized treasuries and RWAs, with products like BlackRock’s BUIDL and Franklin Templeton’s BENJI establishing a template for sustainable growth.
NFTs and Protocol Tokens: These represent the cultural and infrastructural backbone of Ethereum’s app economy, combining speculative activity with productive capital formation.
The relative balance in Ethereum’s structure indicates maturity, while ecosystems overweighted to narrower categories face fragility.
Implications
Durability of Metric: App Capital’s resistance to manipulation makes it a strong candidate for tracking true adoption across chains.
Ethereum’s Trajectory: With nearly $600B already secured, Ethereum is on a credible path toward the first trillion in App Capital. That milestone is both symbolic and practical: it signals Ethereum’s role as the dominant global settlement layer.
Competitive Dynamics: Other L1s may achieve bursts of growth through incentives, but sustaining capital inflows requires more than token engineering—it requires the counterparty risk minimization uniquely enabled by Ethereum’s commitment to maximum decentralization and credible neutrality.
The First Trillion: As with any compounding system, the first trillion is the hardest. Ethereum’s ability to attract diverse forms of user capital—stablecoins, RWAs, DeFi tokens, and cultural assets—places it uniquely in reach of that threshold.
Conclusion
App Capital reframes blockchain competition through a clearer lens: not by hype cycles, tokenomics tricks, or raw throughput numbers, but by measuring how much capital users are willing to entrust to a chain’s app layer. Ethereum’s dominance in this metric is neither cosmetic nor fleeting; it reflects over a decade of ecosystem building, credible neutrality, and user trust.
The road to $1 trillion in App Capital is not just a milestone for Ethereum—it is the marker of blockchain’s maturation as a core financial and cultural infrastructure for the world.
(edited by William Mougayar)