Ethereum Generates $5.7 Trillion of Value. The Market Credits ETH With 4.3% of It
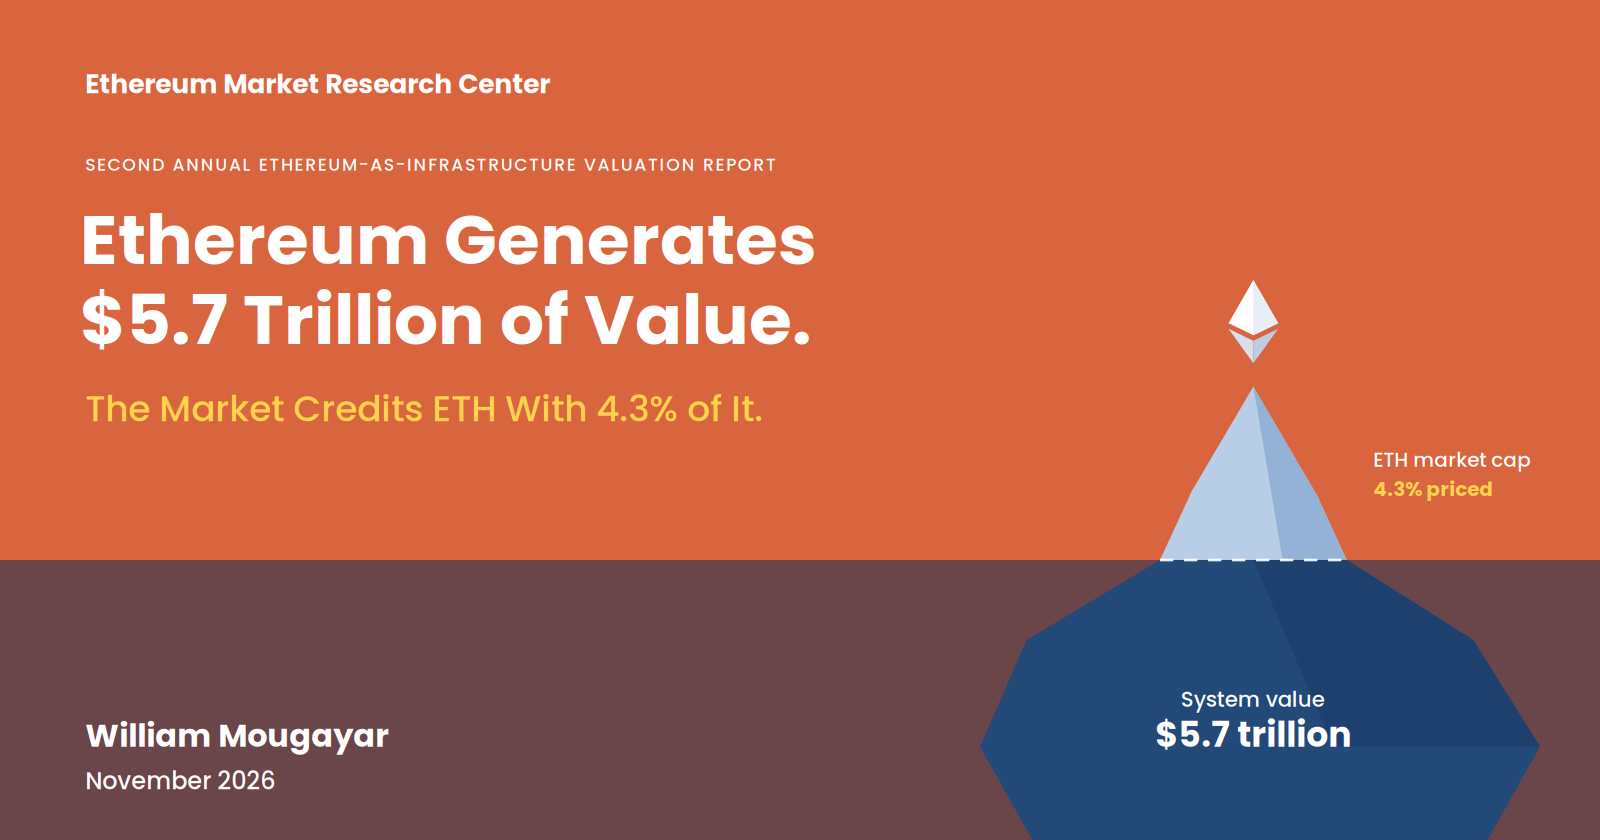
Ethereum generates about $5.7 trillion of value for the economy built on it, yet the market prices ETH at $246 billion, just 4.3% of that. In this second annual Ethereum-as-infrastructure valuation report, William Mougayar values Ethereum as a public good, like the Internet's protocols: through the settlement flows it carries, the trust costs it removes, and the assets built on it. At an Internet-like 15% capture, ETH would be worth about $7,000, 3.5× today's price. New this year: a live model at valuation.ethmrc.com, where anyone can test the assumptions.
DOWNLOAD REPORT (pdf) or read it here.
New this year: a live, real-time version. Users can simulate ETH’s valuation by modifying parameters. Visit valuation.ethmrc.com.
Executive Summary
Ethereum generates about $5.7 trillion of value for the economy built on it. The market prices ETH at $246 billion, or 4.3% of that.
That gap is the point of this note. Ethereum is a public good: like the Internet’s protocols, it enables far more value than it captures. Valuing it by its fees or its token price alone misses most of what it does.
But ETH should not be valued at the whole $5.7 trillion either. Part of that value belongs to other people, and public goods never capture all they enable. The Internet is the benchmark: the companies built on it are worth roughly 10-20% of the total economic value it creates. At an Internet-like 15% capture, ETH would be worth about $7,000, or 3.5× today’s price.
| Measure | Value | |
|---|---|---|
| System value | $5.71T | What Ethereum enables |
| ETH market cap | $246B | What the market pays |
| Share priced into ETH | 4.3% | Of system value |
| System value per ETH | $46,700 | If ETH captured all of it |
| Annual value enabled | $389B a year | 1.6× ETH’s market cap |
| ETH fair value at 15% capture | $7,000 per ETH | 3.5× today |
Every rate in the web model is tied to a published benchmark: Visa’s take on the payments it carries, the cost of trust in traditional finance, and the Internet’s captured share. All figures are a snapshot of the live dashboard’s inputs on November 12, 2026. The dashboard refreshes its market data hourly, so its numbers will drift from these.
What Changed Since Last Year
This note updates The Internet’s Blueprint for Ethereum: A Trillion-Dollar Public Goods Valuation Framework, published in December 2025. The core idea is unchanged: value Ethereum the way we would value the Internet, through what it enables rather than what it charges. What changed is how the pieces fit together, and how the answer relates to ETH’s price.
Last year’s framework focused on three lenses: captured value (ETH plus the L2s and DeFi apps), flow value and trust surplus. It landed on $2-6 trillion near term and $10-20 trillion in the long run, and suggested ETH’s market cap could track that total over time.
A year later, a live model surfaced for that framework, along with eight refinements:
| December 2025 framework | This update | |
|---|---|---|
| ETH’s market cap | Counted inside captured value | Taken out and used as the benchmark ratio |
| Value built on Ethereum | L2s and DeFi blue chips | Tier 1 assets at face value, plus a new Tier 2 for listed and private companies that depend on Ethereum (Robinhood, Coinbase, Circle, Tether) |
| Chains using the EVM standard | Not covered | A new Tier 3, credited at a 10% attribution rate |
| Infrastructure capture rate | 0.3-1% | Straight 0.3%, a conservative range |
| Trust surplus | 1-3 basis points on value secured | 25 basis points on all trust-surplus related Ethereum flows |
| Staking | Not covered | The fees staking providers earn are counted; gross rewards are not |
| Capitalization | A mix of 12-20× multiples | One rule: a perpetuity at a 7% discount rate, about 14× |
| Time frame | Scenarios out to 2035 | A snapshot of the present, refreshed hourly |
| ETH’s price | ETH could track system value | ETH captures a share of system value, anchored to the Internet’s 15% |
The last change matters. Last year’s framework left the impression that ETH might one day be worth all of the value Ethereum enables. This update separates the two questions: how much value does Ethereum create, and how much of it can ETH reasonably capture?
How the Internet Is Valued: A + B + C
Nobody can buy shares in TCP/IP, yet the Internet is the most valuable infrastructure ever built. Its protocols are public goods: anyone can use them, one person’s use takes nothing from another’s, and they charge almost nothing. Their value shows up everywhere except in their own revenues.
Last year’s paper valued the Internet in three buckets:
- A. Captured value. What markets already price: the companies built on the Internet. Pure Internet companies are worth about $13 trillion; counting a share of big tech, cloud, telecom and semiconductors, $20-30 trillion.
- B. Flow value. The economic activity that depends on the Internet. The digital economy is about $16 trillion a year, roughly 15% of world GDP. Taking half of that as truly Internet-dependent and capitalizing $8 trillion a year at 5% gives about $160 trillion.
- C. Consumer surplus. The value people get but never pay for: search, maps, email, messaging, free content. Erik Brynjolfsson’s work puts it in the thousands of dollars per user per year in the US. A conservative global $1,000 per user, across 5 billion users, is about $5 trillion a year, or $70-150 trillion capitalized.
Avoiding double counting, the Internet’s total economic value lands at $100-300 trillion, one to three times world GDP.
Two lessons from that exercise carry over to Ethereum:
- The protocol layer captures almost nothing. The value sits in what it enables.
- The captured layer is a fraction of the total. The companies built on top, the $13-30 trillion in bucket A, hold roughly 4-30% of the Internet’s total value, with a central range of about 10-20%. We will come back to that ratio when we ask what ETH is worth.
The protocol layer captures almost nothing. The value sits in what it enables.
Applying It to Ethereum
Ethereum maps onto the same three buckets, with one structural difference: it has a native asset. TCP/IP has no token; Ethereum has ETH, used as gas, collateral and the stake that secures the network. ETH is the part of Ethereum that markets can price directly.
That difference forces a choice. ETH’s market cap could be one of the buckets, or it could be the yardstick the buckets are measured against. Last year’s framework did the first. This update does the second, for two reasons:
- Counting it in would double count. ETH’s price already reflects expected demand from the activity in bucket B. Adding both counts the same value twice.
- Comparing it is the question we care about. The useful number is how much of what Ethereum directly enables the market credits to ETH.
So the model has two sides:
| What it measures | Ethereum’s version | |
|---|---|---|
| System value | Value Ethereum enables for others | A. Ecosystem value + B. Flow value + C. Trust surplus + EVM standard reach |
| Benchmark | What the market pays for ETH | ETH’s market cap: $246B |
In Ethereum’s terms, the three buckets are:
- A. Ecosystem value. Assets and businesses built on Ethereum, at the prices markets give them. The equivalent of the Internet’s captured layer.
- B. Flow value. The value of the economic activity Ethereum settles: stablecoins, trading, lending, tokenized assets. The equivalent of the Internet’s share of GDP.
- C. Trust surplus. What users would have paid for trust in the traditional system, minus what they pay on Ethereum. The equivalent of the Internet’s consumer surplus.
Buckets B and C are annual amounts, converted to present value. Bucket A is already a market price, so it is taken as quoted.
A. Ecosystem Value: $127 Billion
Ecosystem value is what others have built on Ethereum, at the prices markets give it. It comes in two tiers. Market prices are already present values, so no capitalization applies to this bucket.
Tier 1: assets secured by Ethereum, $25.3 billion
Projects that live on Ethereum and its rollups are counted at face value, based on their token valuations. They would not exist in their current form without it, and we are not judging whether the market prices them well, only crediting Ethereum for enabling them. Each sector sums a fixed list of tokens, priced live from CoinGecko; the lists are in the appendix.
| Tier 1 sector | Tokens | Market cap |
|---|---|---|
| DeFi blue chips | 11 | $11.9B |
| Infrastructure and services | 6 | $8.2B |
| L2 tokens | 11 | $4.1B |
| Liquid staking and restaking | 5 | $1.1B |
| Tier 1 total | $25.3B |
The live site reflects where token prices actually sit today, updated hourly.
Tier 2: companies that depend on Ethereum, $102 billion
Some of the most important builders on Ethereum are companies whose shares trade on stock markets, or which are valued privately. Their business only partly runs on Ethereum, so we credit Ethereum with the matching share of their value:
Tier 2 credit = Market cap × (Ethereum-dependent revenue ÷ Total revenue)
| Company | Market cap | Ethereum-dependent revenue / yr | Total revenue / yr | Share | Credit to Ethereum |
|---|---|---|---|---|---|
| Tether | $200B (private valuation) | $880M | $2.0B | 44% | $88.0B |
| Circle | $16.6B | $1.75B | $2.7B | 65% | $10.8B |
| Robinhood | $75.1B | $100M | $5.68B | 1.8% | $1.3B |
| Securitize | $1.4B | $70M | $110M | 64% | $0.9B |
| Coinbase | $35.2B | $100M | $5.0B | 2.0% | $0.7B |
| Tier 2 total | $101.7B |
Listed companies’ market caps come from a live Finnhub feed.
Three judgment calls sit behind these rows:
- Reported revenue, not gross chain fees. Robinhood Chain generated about $50 million in fees in its first quarter on mainnet, Q3 2026, but Robinhood reported $25 million of it as revenue. The difference is potentially the cost of running the chain, part of which is paid to Ethereum / Arbitrum for settlement and is therefore already in ETH’s price. Using gross fees would count it twice. Both quarterly figures are annualized here.
- Onchain volume is counted once. Robinhood Chain’s DEX volume, about $320 billion a year, is added to flow value under Robinhood. Base activity and USDC and USDT transfers are already in the Tier 1 flows, so Coinbase, Circle and Tether add no volume of their own.
- Tether is valued privately. It has no market cap, so its row uses a $200 billion estimated private valuation, and 44% for the share of USDT issued on Ethereum. It is the most debatable row in the table, and now by far the largest part of ecosystem value.
B. Flow Value: $3.01 Trillion
Flow value is the value of the economic activity that runs on Ethereum and its rollups. Stablecoins dominate it.
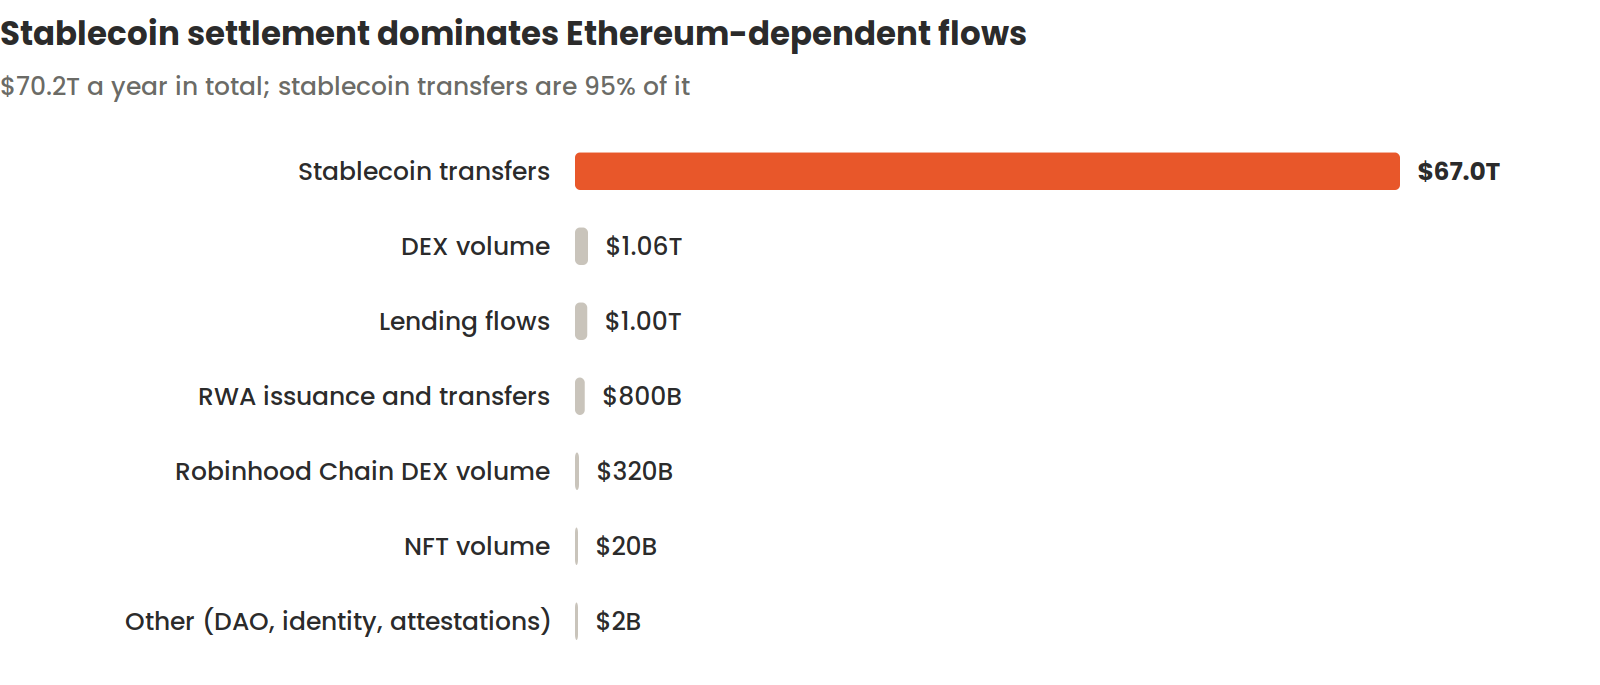
Dashboard inputs, November 12, 2026. Stablecoin transfers: Ethereum and L2s, raw volume. DEX volume: live DeFi Llama feed. Robinhood Chain: Q3 2026 × 4.
Ethereum and its L2s settled $16.75 trillion of stablecoin transfers in the 89 days to October 12, 2026. The model uses $67 trillion a year for stablecoin transfers, slightly below the straight annualized figure. Add trading, lending, tokenized assets and the rest, and Ethereum-dependent flows come to $70.2 trillion a year. DEX volume, at $1.06 trillion, comes from a live DeFi Llama feed across Ethereum and seven of its rollups. Derivatives settled on Ethereum are too small to count as a separate flow.
Settlement infrastructure never keeps the value it moves. The best-paid settlement business in the world, Visa, earned $40.0 billion of net revenue in fiscal 2025 on about $14 trillion of payments: a take of about 0.29%. Wholesale infrastructure earns far less: DTCC settled $4.7 quadrillion of securities transactions in 2025, for a sliver of a basis point.
We use 0.3%, Visa’s take, as the share of each flow that is value added by the infrastructure underneath it. It is effectively a ceiling: we credit Ethereum with what the richest settlement network earns per dollar, not with an average.
Annual value from flows = $70.2T × 0.3% = $210.6B
Staking services add $228 million a year. About 44.51 million ETH is staked. At $2,016 per ETH and an average yield of 2.54%, stakers earn about $2.28 billion a year. Staking providers typically keep 5-15% of rewards as their fee; at 10%, they earn about $228 million. That fee is value Ethereum creates for a business built on it, so it is counted.
The gross rewards are not counted, for two reasons. Most of them are newly issued ETH, which moves value from holders who don’t stake to those who do rather than creating new wealth. And all of them accrue to ETH holders, which ETH’s market cap already reflects.
| Per year | |
|---|---|
| Value from flows | $210.6B |
| Staking services revenue | $0.23B |
| Annual value added | $210.8B |
| Flow value, at 14.3× | $3.01T |
The $67 trillion is raw transfer volume, the same basis as last year’s paper. Infrastructure is valued on everything it carries: card networks and clearinghouses earn on all their volume, trading included, and automated activity still uses and pays for Ethereum’s settlement.
C. Trust Surplus: $2.55 Trillion
Trust surplus is the cost of trust that Ethereum removes. In traditional finance, trust is expensive: auditors verify, clearinghouses settle, custodians hold, rating agencies vouch, accountants reconcile and courts enforce. Ethereum replaces much of that with cryptography, consensus and code, at close to zero marginal cost.
Trust surplus = What users would pay for trust in the traditional system − What they pay on Ethereum
It is the Ethereum equivalent of the Internet’s consumer surplus: real, unpriced, and invisible in fees. We estimate it based on its two components.
| Method | Calculation | Per year |
|---|---|---|
| Per user | $250 of surplus per user × 12 million meaningful annual users | $3.0B |
| Systemic | 25 basis points of trust cost removed × $70.2T of dependent flows | $175.5B |
| Total | $178.5B |
The systemic method is larger because Ethereum’s trust surplus scales with the value it secures, not with the number of people using it. A single institution moving a billion dollars on Ethereum saves more in reconciliation and counterparty risk than thousands of retail users combined.
- Systemic: trust costs removed from transactions: settlement, reconciliation, counterparty risk, all scaling with volume.
- Per user: benefits that don’t scale with volume: self-custody, open access with no account or intermediary, portable identity and assets.
Why 25 basis points. It is the cost of trust per dollar moved: custody, reconciliation, compliance, settlement delays, collateral held against counterparty risk, and cross-border fees. That cost depends heavily on what is moving. Retail cross-border payments are expensive: the World Bank’s global average cost of sending a remittance is 6.49%. Wholesale and securities settlement costs a few basis points or less.
Most of Ethereum’s raw volume is trading, DeFi routing and other wholesale-like activity, so the blended cost has to be weighted toward the low end. If roughly a tenth of the volume is payments-like and the rest wholesale-like, the blended cost of trust is about 20-25 basis points. We use 25.
That also separates the two buckets in principle. Flow value measures what the infrastructure earns, anchored to Visa’s take. Trust surplus measures what users save, anchored to the cost of trust in traditional finance. At 14.3×, the trust surplus is worth $2.55 trillion. Each 5 basis points adds or removes about $0.5 trillion.
From Annual Value to Present Value
Flow value and trust surplus start as amounts per year. To compare them with market caps, which are prices paid today for all future value, each is converted to a present value.
We treat both as a perpetuity: a stream that continues indefinitely, discounted at 7%.
Present value = Annual value ÷ 7% = 14.3 × Annual value
A perpetuity fits the public-infrastructure argument. TCP/IP’s value did not stop after ten years, and there is no reason to assume Ethereum’s settlement role will either.
We discount at 7% and assume Ethereum’s activity never grows from today’s level. For a network whose activity has grown every year, that is a deliberately conservative assumption. Last year’s paper used 5% as its main rate and 7-8% as an alternative; this update applies 7% everywhere, in place of the earlier mix of 12×, 14× and 20× multiples.
Putting It Together: $5.7 Trillion
Adding the three buckets, plus a small credit for the EVM standard, gives Ethereum’s system value: the value it enables for the economy built on it.
System value = $0.13T (A. Ecosystem) + $3.01T (B. Flow) + $2.55T (C. Trust) + $0.02T (EVM reach) = $5.71T
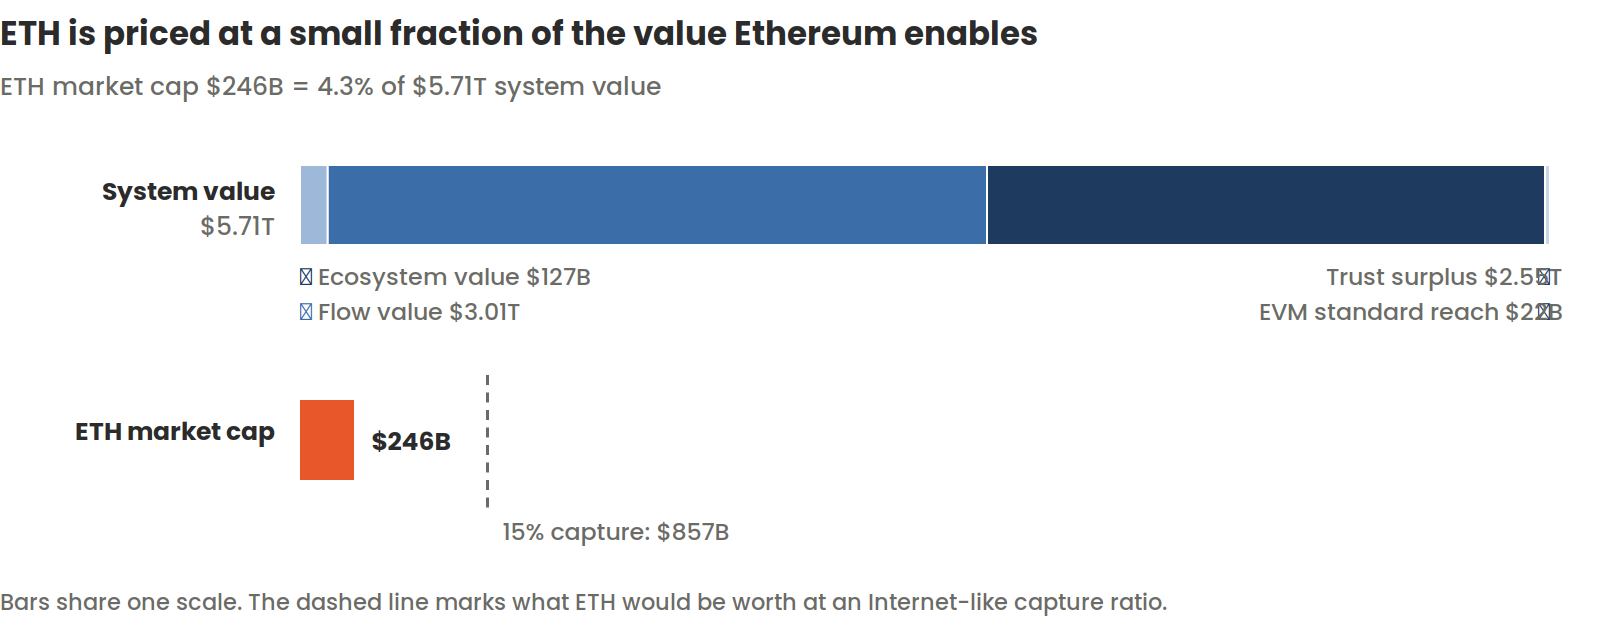
Dashboard inputs, November 12, 2026. Flow value and trust surplus capitalized as a perpetuity at 7% (14.3×).
Flow value is a little over half of the total, and trust surplus most of the rest. Ethereum’s value lies in what it settles and the trust it replaces, which echoes the Internet, where the GDP it carries and the surplus it creates dwarf the companies built on it.
Against that, ETH’s market cap of $246 billion is 4.3% of system value. Put the other way, for every $1 the market pays for ETH, Ethereum generates about $23 of value for the ecosystem built on it.
For every $1 the market pays for ETH, Ethereum generates about $23 of value for the ecosystem built on it.
That ratio is not a price target. It measures the gap between what Ethereum enables and what ETH is credited with, which is the central claim of the public-goods thesis. The next section asks what share of that value ETH can reasonably claim.
What ETH Captures: $7,000 per ETH
System value is what Ethereum enables. It is not what ETH is worth, and treating the two as equal would contradict the thesis this framework rests on. Three reasons:
- Part of system value belongs to others by definition. Tier 1 and Tier 2 are other people’s assets: L2 tokens, DeFi tokens, shares in Robinhood and Circle, a stake in Tether. ETH cannot be worth Circle’s market cap.
- Public goods do not capture what they enable. That is the whole argument. TCP/IP captures almost nothing. ETH captures more than a protocol because it is the asset that secures and coordinates the network, but still only part of the value it supports.
- Flow value is shared infrastructure value. The 0.3% capture rate measures what the infrastructure earns, and that infrastructure is shared between Ethereum, the L2s, stablecoin issuers, custodians and apps. ETH is one claimant among several.
So the right question is what share of system value ETH can reasonably capture. We call that share the capture ratio:
ETH fair value = (System value × Capture ratio) ÷ ETH supply
The Internet supplies the anchor. In last year’s paper, the companies built on the Internet were worth $13-30 trillion, against $100-300 trillion of total economic value the Internet creates. The companies built on it are worth roughly 10-20% of that total. Applying that range to Ethereum is not a number chosen to land on a comfortable multiple. It applies the same analogy, consistently, to the asset that sits in Ethereum’s captured layer.
| Capture ratio | Implied ETH market cap | Value per ETH | vs today |
|---|---|---|---|
| 4.3%, what the market implies today | $246B | $2,016 | 1.0× |
| 10%, low | $571B | $4,673 | 2.3× |
| 15%, central case | $857B | $7,010 | 3.5× |
| 20%, high | $1.14T | $9,347 | 4.6× |
| 100%, all of system value | $5.71T | $46,734 | 23× |
Read this way, today’s price says something specific: the market credits ETH with less than 5% of what Ethereum enables, under half the low end of the Internet range. Either ETH’s capture of its own ecosystem will rise toward Internet-like levels, or the market is pricing in that it never will. That is the debate this framework makes explicit.
We present a range rather than a point on purpose. The 15% case is a reasoned central estimate, not a forecast with a date attached.
Annual Value Enabled: $389 Billion a Year
The system value depends on the capitalization multiple. A second measure does not: the value Ethereum enables each year, before any capitalization.
| Per year | |
|---|---|
| Value added from flows | $210.6B |
| Staking services revenue | $0.2B |
| Trust surplus | $178.5B |
| Annual value enabled | $389.3B |
That is 1.6× ETH’s market cap. Ethereum enables more value every year than the market currently pays for ETH in total.
Ethereum enables more value every year than the market currently pays for ETH in total.
This works like an earnings yield turned around. It holds whatever discount rate or time horizon you prefer, which makes it the hardest number in this note to dismiss. Ecosystem value is left out because it is already a market price, with no annual version.
Tier 3: The EVM Standard, Credited at 10%
Ethereum’s influence reaches beyond its own network. Hyperliquid’s HyperEVM, BNB Chain and Avalanche’s C-Chain run the Ethereum Virtual Machine, use Solidity and the ERC token formats, and rely on Ethereum’s tooling. They don’t settle on Ethereum or depend on its security, but they would not look the way they do without it.
That is the purest form of the public-goods argument: a standard adopted far beyond the network that created it, just as TCP/IP spread beyond the networks that built it. Ethereum deserves credit for it, at a low rate:
EVM credit = Attribution × (Token market cap + Volume × Capture rate × 14.3)
| Chain | Token market cap | Volume / yr | Attribution | Credit to Ethereum |
|---|---|---|---|---|
| Hyperliquid (HyperEVM) | $17.1B | $2.26T | 10% | $11.4B |
| BNB Chain | $86.2B | $345B | 10% | $10.1B |
| Avalanche C-Chain | $3.7B | $31B | 10% | $0.5B |
| Uniswap on non-Ethereum chains | - | $75B | 10% | $0.3B |
| Total | $22.3B |
We include Tier 3 in system value, as its own line. It adds about $22 billion, or 0.4% of the total, so it does not inflate the headline, and the 10% attribution is stated openly. Readers who prefer to count only value that settles on Ethereum can switch it off on the dashboard, where it appears as a halo around the iceberg.
What Is Not Counted, and the Limits of This Model
Left out on purpose
- ETH’s own market cap, which is the benchmark, not a bucket.
- Gross staking rewards, which are mostly issuance and accrue to ETH holders. Only providers’ fees count.
- Gross chain fees, where a company reports less as revenue. Only reported revenue counts.
- Tier 3 at full value. Chains that only use the EVM standard are credited at 10%, not at their whole value.
- Option value. New sectors that may come to depend on Ethereum, such as AI agents transacting onchain, machine-to-machine payments or central-bank collateral networks, are not counted until they show up in flows. This is a snapshot of the present, not a forecast.
Known limits
- Tier 1 depends on curated token lists. Each sector sums a fixed list of tokens, shown in the appendix. Adding or removing a token changes the total, and multi-chain tokens such as LINK and UNI are counted in full.
- Tether’s valuation is private. It is the largest Tier 2 item and the most contestable one.
- Some flow volumes are still estimates. RWA and NFT volumes carry over from last year’s paper until their feeds are connected.
- The capture ratio comes from an analogy. The Internet’s captured share is a reasoned anchor, not a law. The next step is a bottom-up cross-check: valuing ETH directly from its monetary, collateral and security premiums, the three roles last year’s paper described, and seeing whether that lands in the same range.
- Some overlap between Tier 1 and flow value is accepted by design. DeFi and L2 tokens earn part of their value from the same flows. We credit Ethereum for enabling both, rather than attempting to judge how the market prices those tokens.
Appendix: Inputs, Formulas and Sources
Inputs, November 12, 2026
| Input | Value | Source |
|---|---|---|
| ETH market cap | $246B | CoinGecko, live feed |
| ETH supply | 122.2M ETH | CoinGecko, live feed |
| Discount rate | 7%, perpetuity (14.3×) | Model setting |
| Infrastructure capture rate | 0.3% | Model setting; Visa’s FY2025 take of about 0.29% |
| Stablecoin transfers | $67.0T a year | Raw volume, Ethereum and L2s; $16.75T in July 15 to October 12, 2026 |
| DEX volume | $1.06T a year | DeFi Llama, live, Ethereum and 7 rollups |
| Lending flows | $1.0T a year | Model input |
| RWA issuance and transfers | $0.8T a year | Estimate; feed pending |
| NFT volume | $20B a year | Estimate; feed pending |
| Other (DAO, identity, attestations) | $2B a year | Model input |
| Robinhood Chain DEX volume | $320B a year | Robinhood Q3 2026, × 4 |
| ETH staked | 44.5M ETH | Dune Analytics |
| Average staking yield | 2.54% | Model setting |
| Staking providers’ fee share | 10% | Model setting; typical range 5-15% |
| Trust surplus per user | $250 a year, 12M users | Model setting |
| Trust cost reduction | 25 bps of dependent flows | Model setting |
| Tier 1, L2 tokens ($4.1B) | ARB, OP, STRK, ZK, MNT, LINEA, SCR, IMX, METIS, TAIKO, POL | CoinGecko, live |
| Tier 1, DeFi blue chips ($11.9B) | AAVE, UNI, SKY, ENA, PENDLE, CRV, MORPHO, COMP, SNX, 1INCH, LIT | CoinGecko, live |
| Tier 1, liquid staking and restaking ($1.1B) | LDO, RPL, ETHFI, SWISE, EIGEN | CoinGecko, live |
| Tier 1, infrastructure and services ($8.2B) | ENS, SSV, OBOL, SAFE, GRT, LINK | CoinGecko, live |
| Robinhood | $75.1B market cap; $100M of $5.68B revenue | Finnhub, live; Q3 2026 results, × 4 |
| Coinbase | $35.2B market cap; $100M of $5.0B revenue | Finnhub, live; Base fee revenue |
| Circle | $16.6B market cap; $1.75B of $2.7B revenue | Finnhub, live; FY2025 revenue, about 65% on Ethereum |
| Securitize | $1.4B market cap; $70M of $110M revenue | Finnhub, live; 2026 revenue outlook |
| Tether | $200B private valuation; 44% of $2.0B revenue | Author’s inputs |
| Tier 3 market caps and volumes | See the Tier 3 table | CoinGecko, DeFi Llama and Hyperliquid, live |
| Tier 3 attribution | 10% | Model setting |
| ETH capture ratio | 15% central, 10-20% range | Internet captured share, from the December 2025 paper |
Formulas
| Ecosystem value | Sum of Tier 1 market caps + Sum of (each company’s market cap × Ethereum revenue ÷ total revenue) |
| Flow value | (Dependent flows × capture rate + staking services revenue) ÷ discount rate |
| Staking services revenue | ETH staked × ETH price × staking yield × providers’ fee share |
| Trust surplus | The sum of (surplus per user × users) and (dependent flows × trust cost in bps), ÷ discount rate |
| EVM reach | Sum of attribution × (token market cap + volume × capture rate ÷ discount rate) |
| System value | Ecosystem value + flow value + trust surplus + EVM reach |
| ETH fair value | System value × capture ratio ÷ ETH supply |
Sources
- William Mougayar, The Internet’s Blueprint for Ethereum: A Trillion-Dollar Public Goods Valuation Framework, Ethereum Market Research Center, December 2025.
- Visa Inc., Form 10-K for fiscal 2025 and fiscal 2025 annual report: $40.0B net revenue; about $14T of payments volume.
- DTCC: $4.7 quadrillion of securities transactions processed in 2025.
- World Bank, Remittance Prices Worldwide, Issue 53: global average cost of sending a remittance, 6.49%.
- Robinhood reports third quarter 2026 results: revenue, Robinhood Chain fees and DEX volume.
- Ethereum and its L2s settled 77% of stablecoin volume: $16.75T in transfers, July 15 to October 12, 2026.
- Bitmine reports 86% of Ether holdings staked: Dune count of ETH staked on October 15, 2026.
- Erik Brynjolfsson et al. on the consumer surplus of free digital services, as cited in the December 2025 paper.
The live model behind these numbers, with its inputs, formulas and a simulation mode, is on the Ethereum Infrastructure System Valuation dashboard at valuation.ethmrc.com.
About the Author

William Mougayar is a longtime Ethereum advisor, investor, and influential voice in blockchain. With 40+ years in technology as an executive, entrepreneur, analyst, and author, he brings rare depth to the industry. His book The Business Blockchain (Wiley, 2016) became a global reference in 10 languages. He previously held senior roles at Hewlett-Packard, Cognizant, and Aberdeen Group, founded three startups, and advises leading blockchain companies. He also created the Token Summit, OnEthereum, the WMX Iconomi index, and the Ethereum Market Research Center.
Also by William Mougayar
Upcoming new book, Trustshift: Ethereum and the Reinvention of Trust. trustshiftbook.com